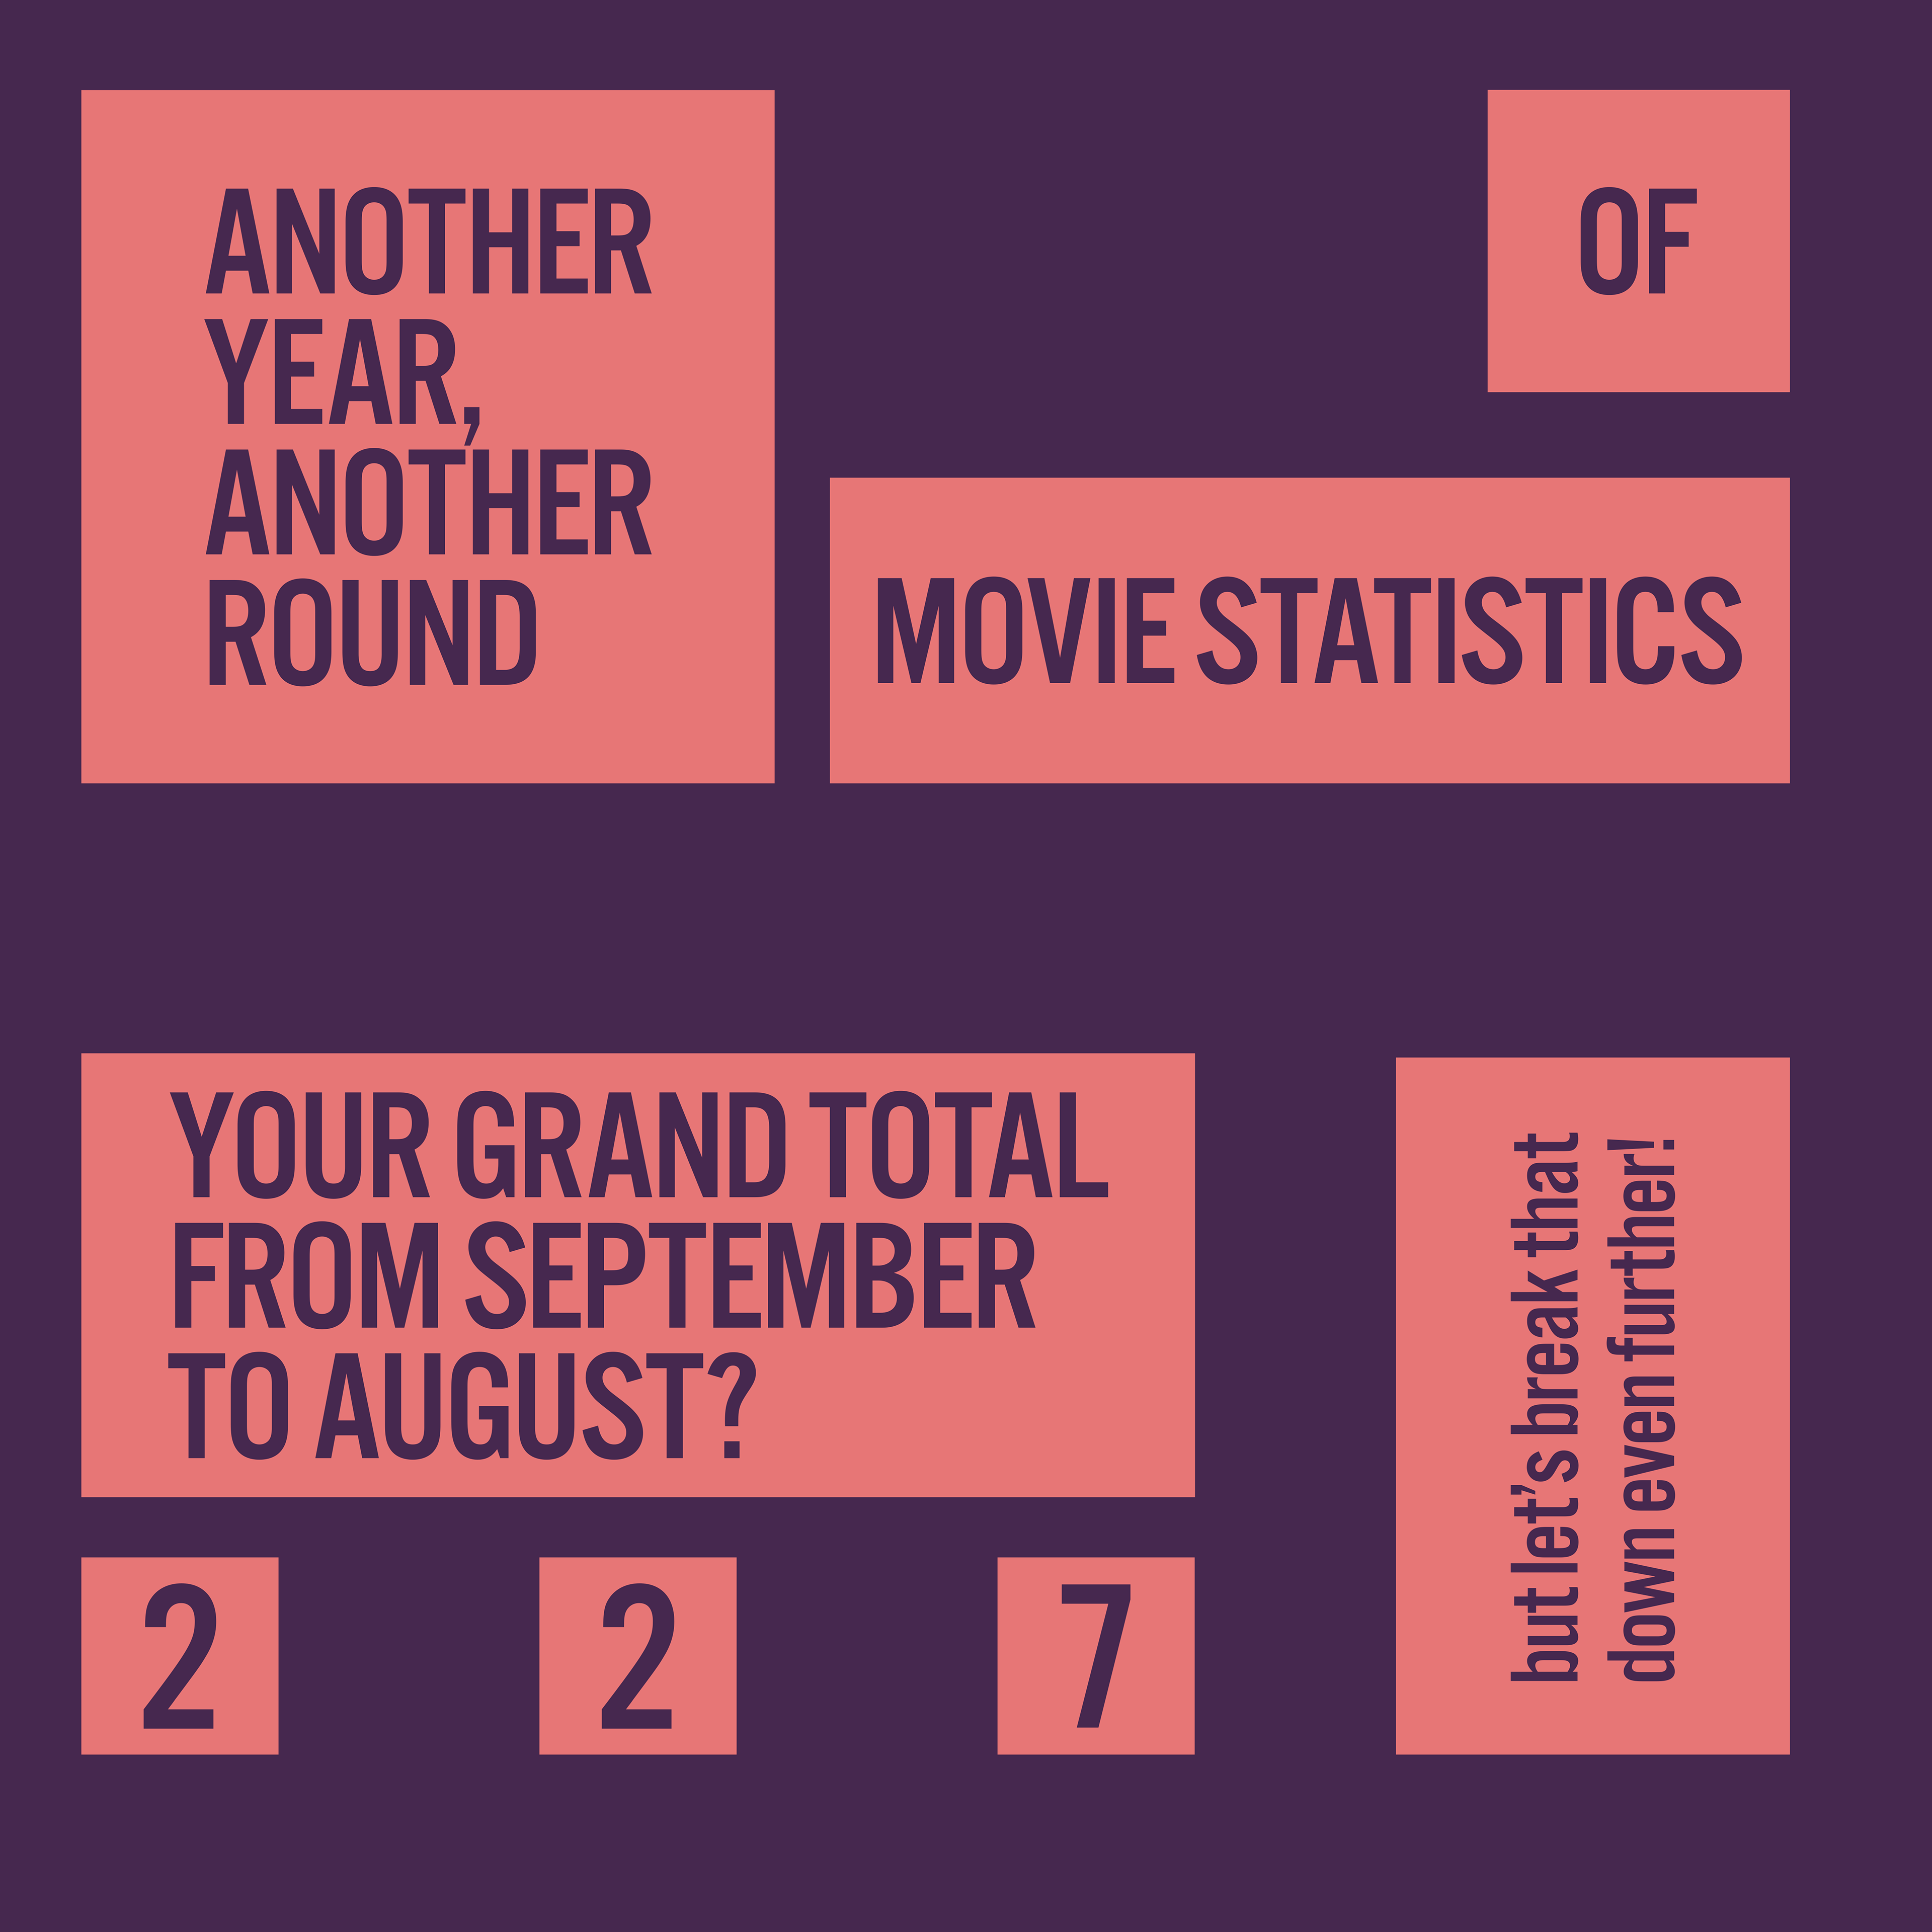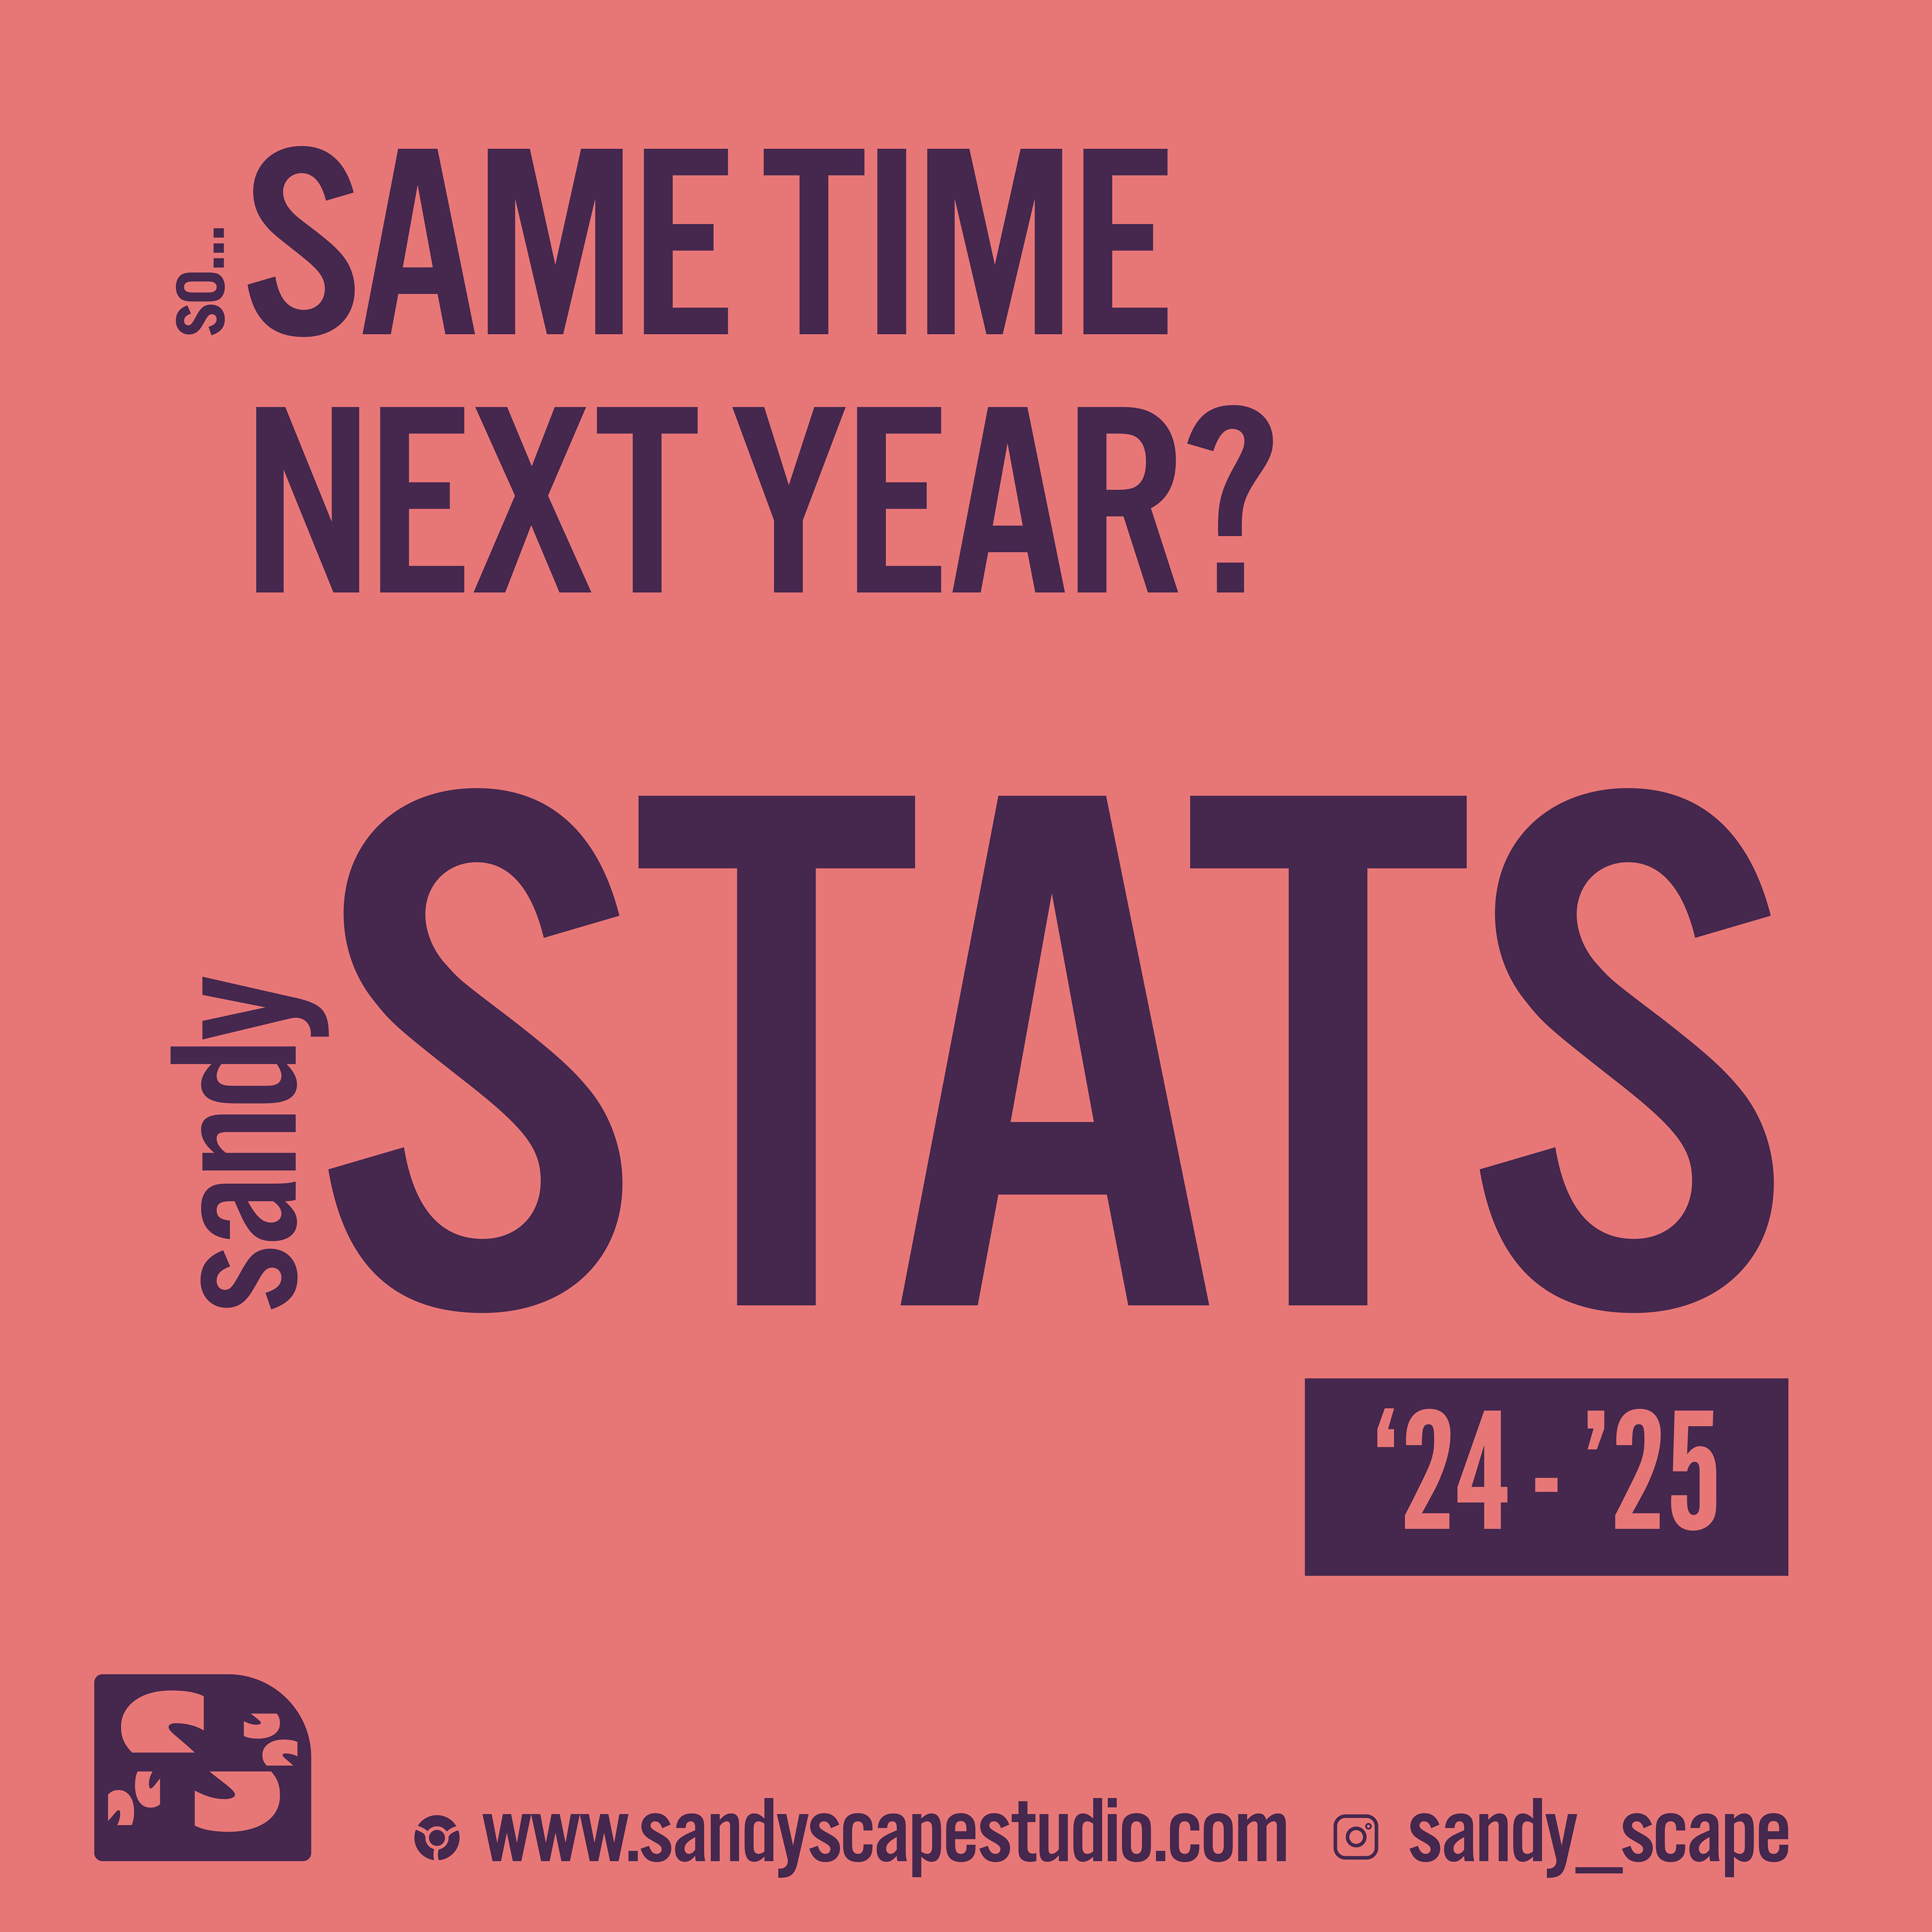
A rebrand of the MA Rewind project created in October 2024, Sandy Stats is the second year in a row of me combining my love of movies with a desire to generate my own infographics.
Similar to how Spotify Wrapped and Apple Replay try to reinvent their visualisation yearly, I wanted to take the same approach. Last year's statistics had a mixed-media background and included unique categories like 'how many times I cried?' or 'How many listens of the song Redbone equated to my total watchtime of movies?' This year's statistics were designed using Illustrator and maintained a sleek colour palette of purple and peach throughout.
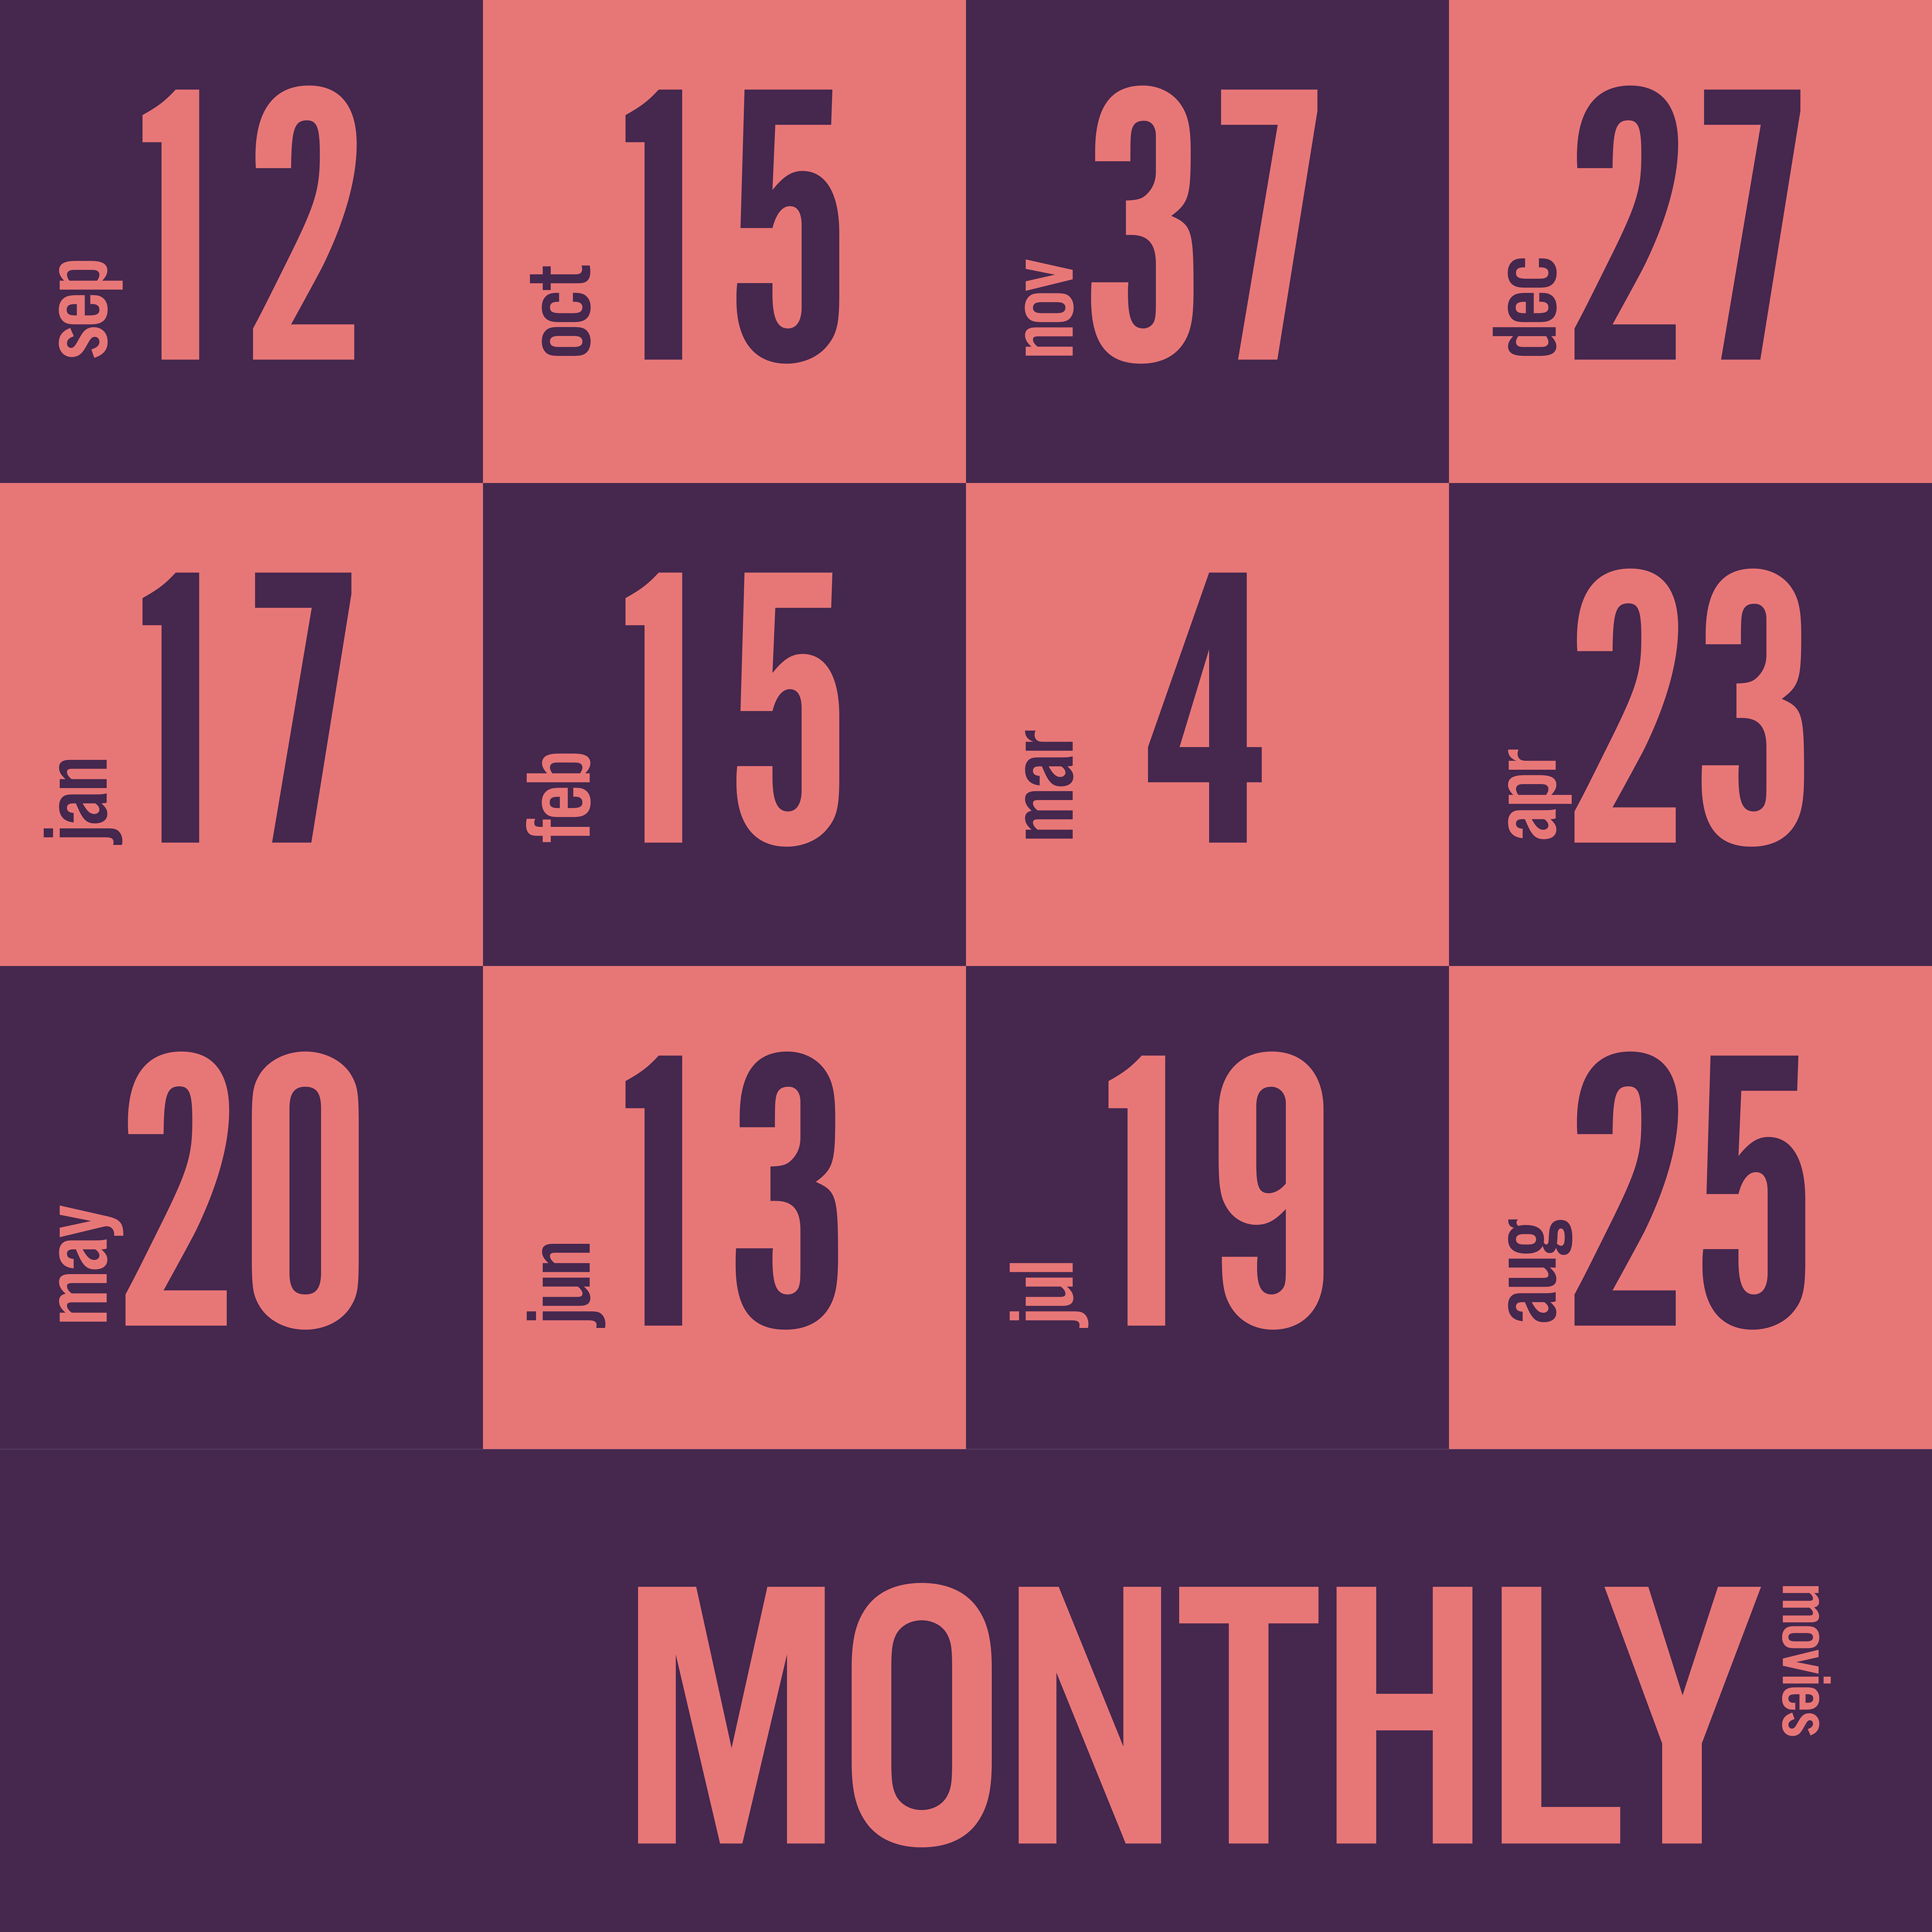
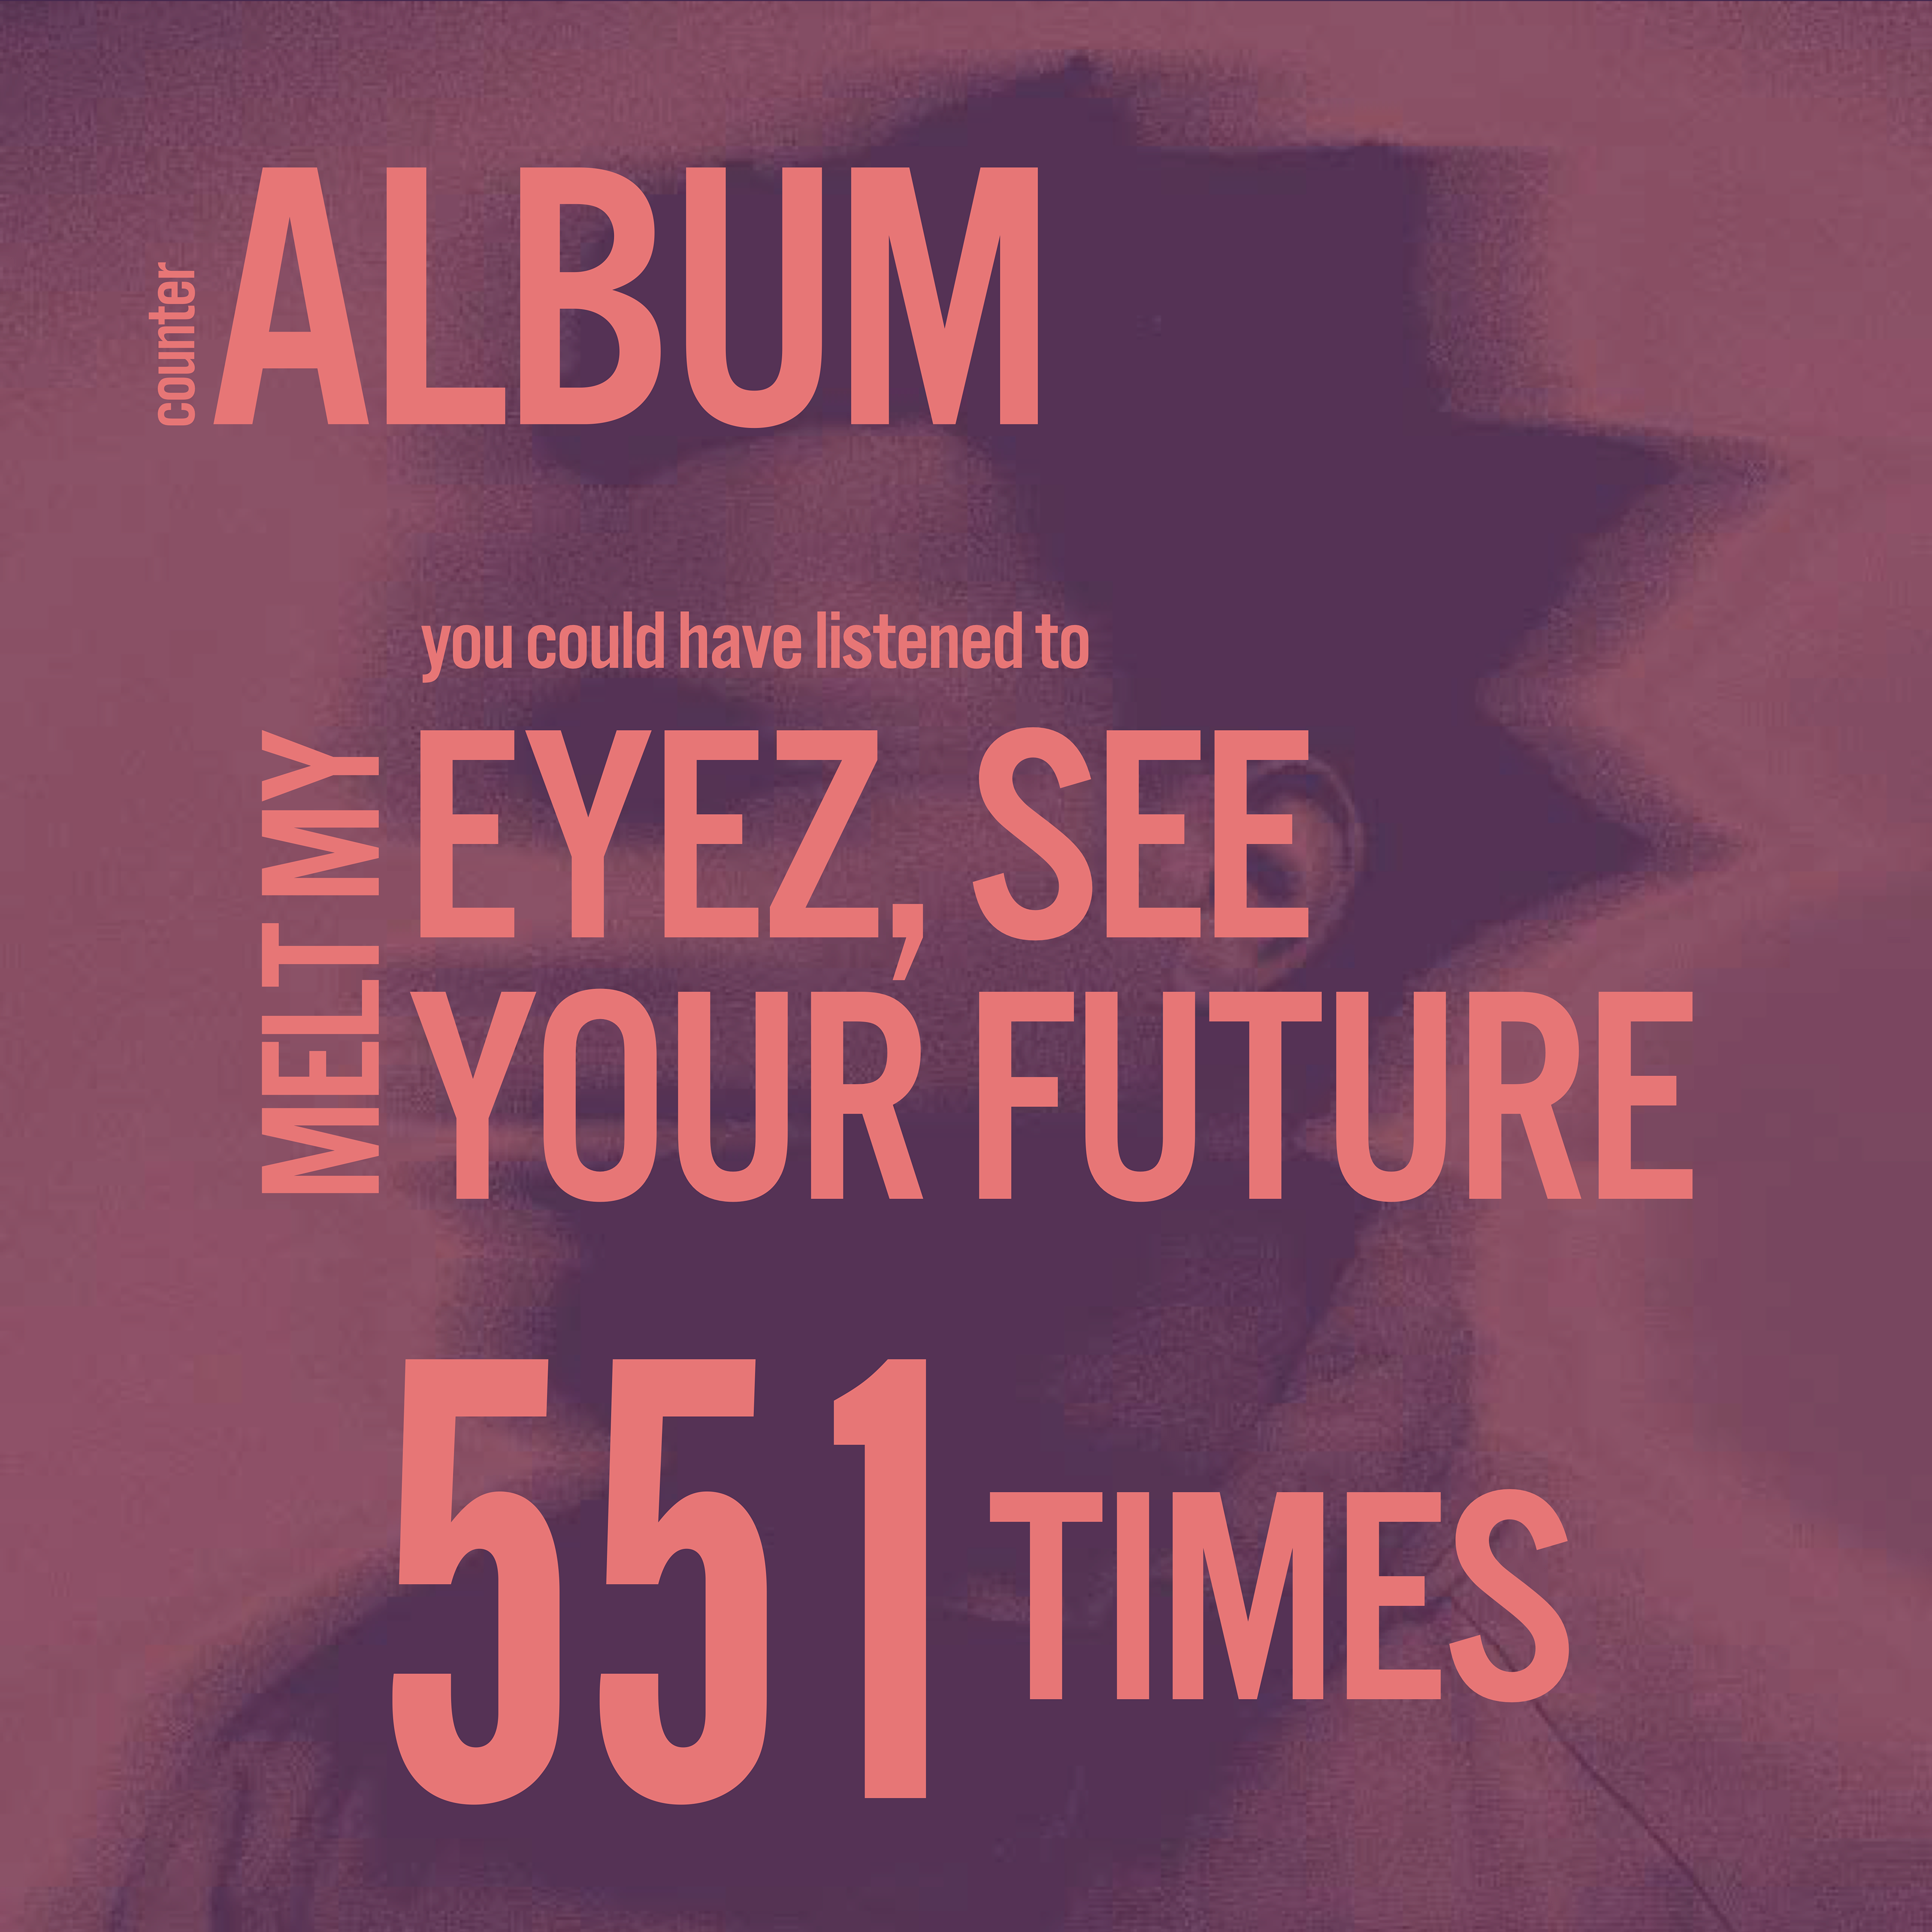
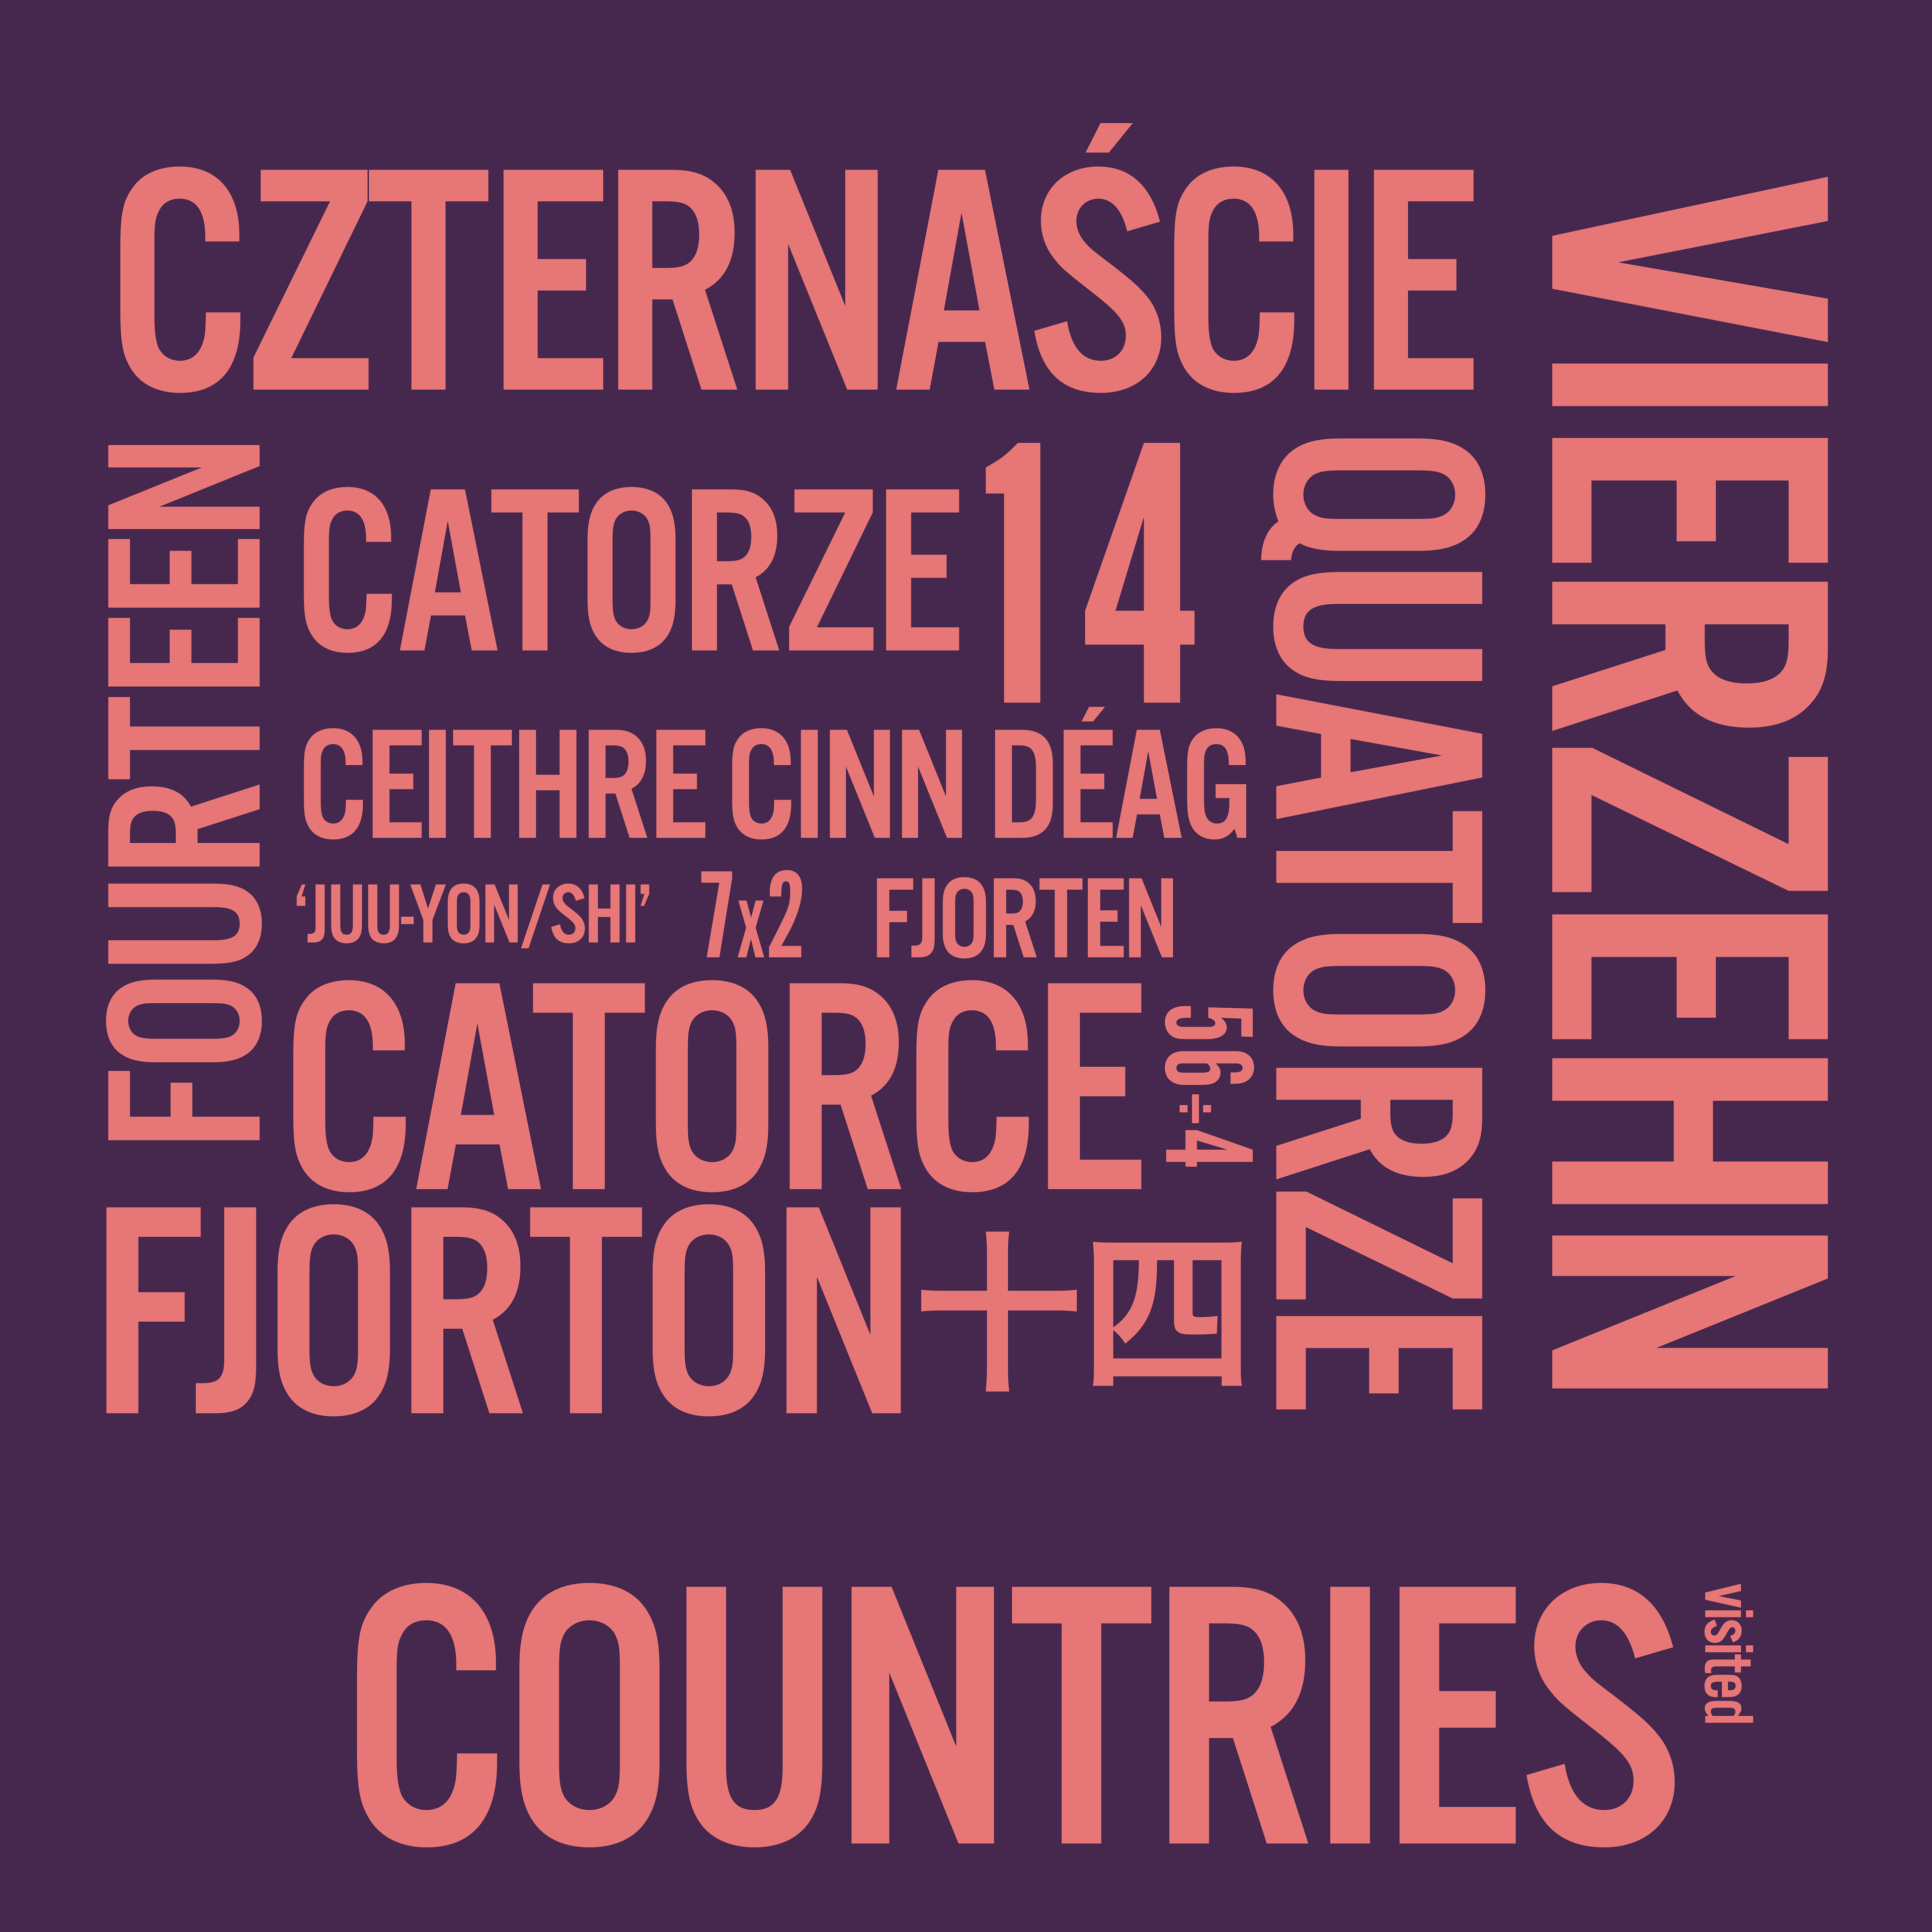
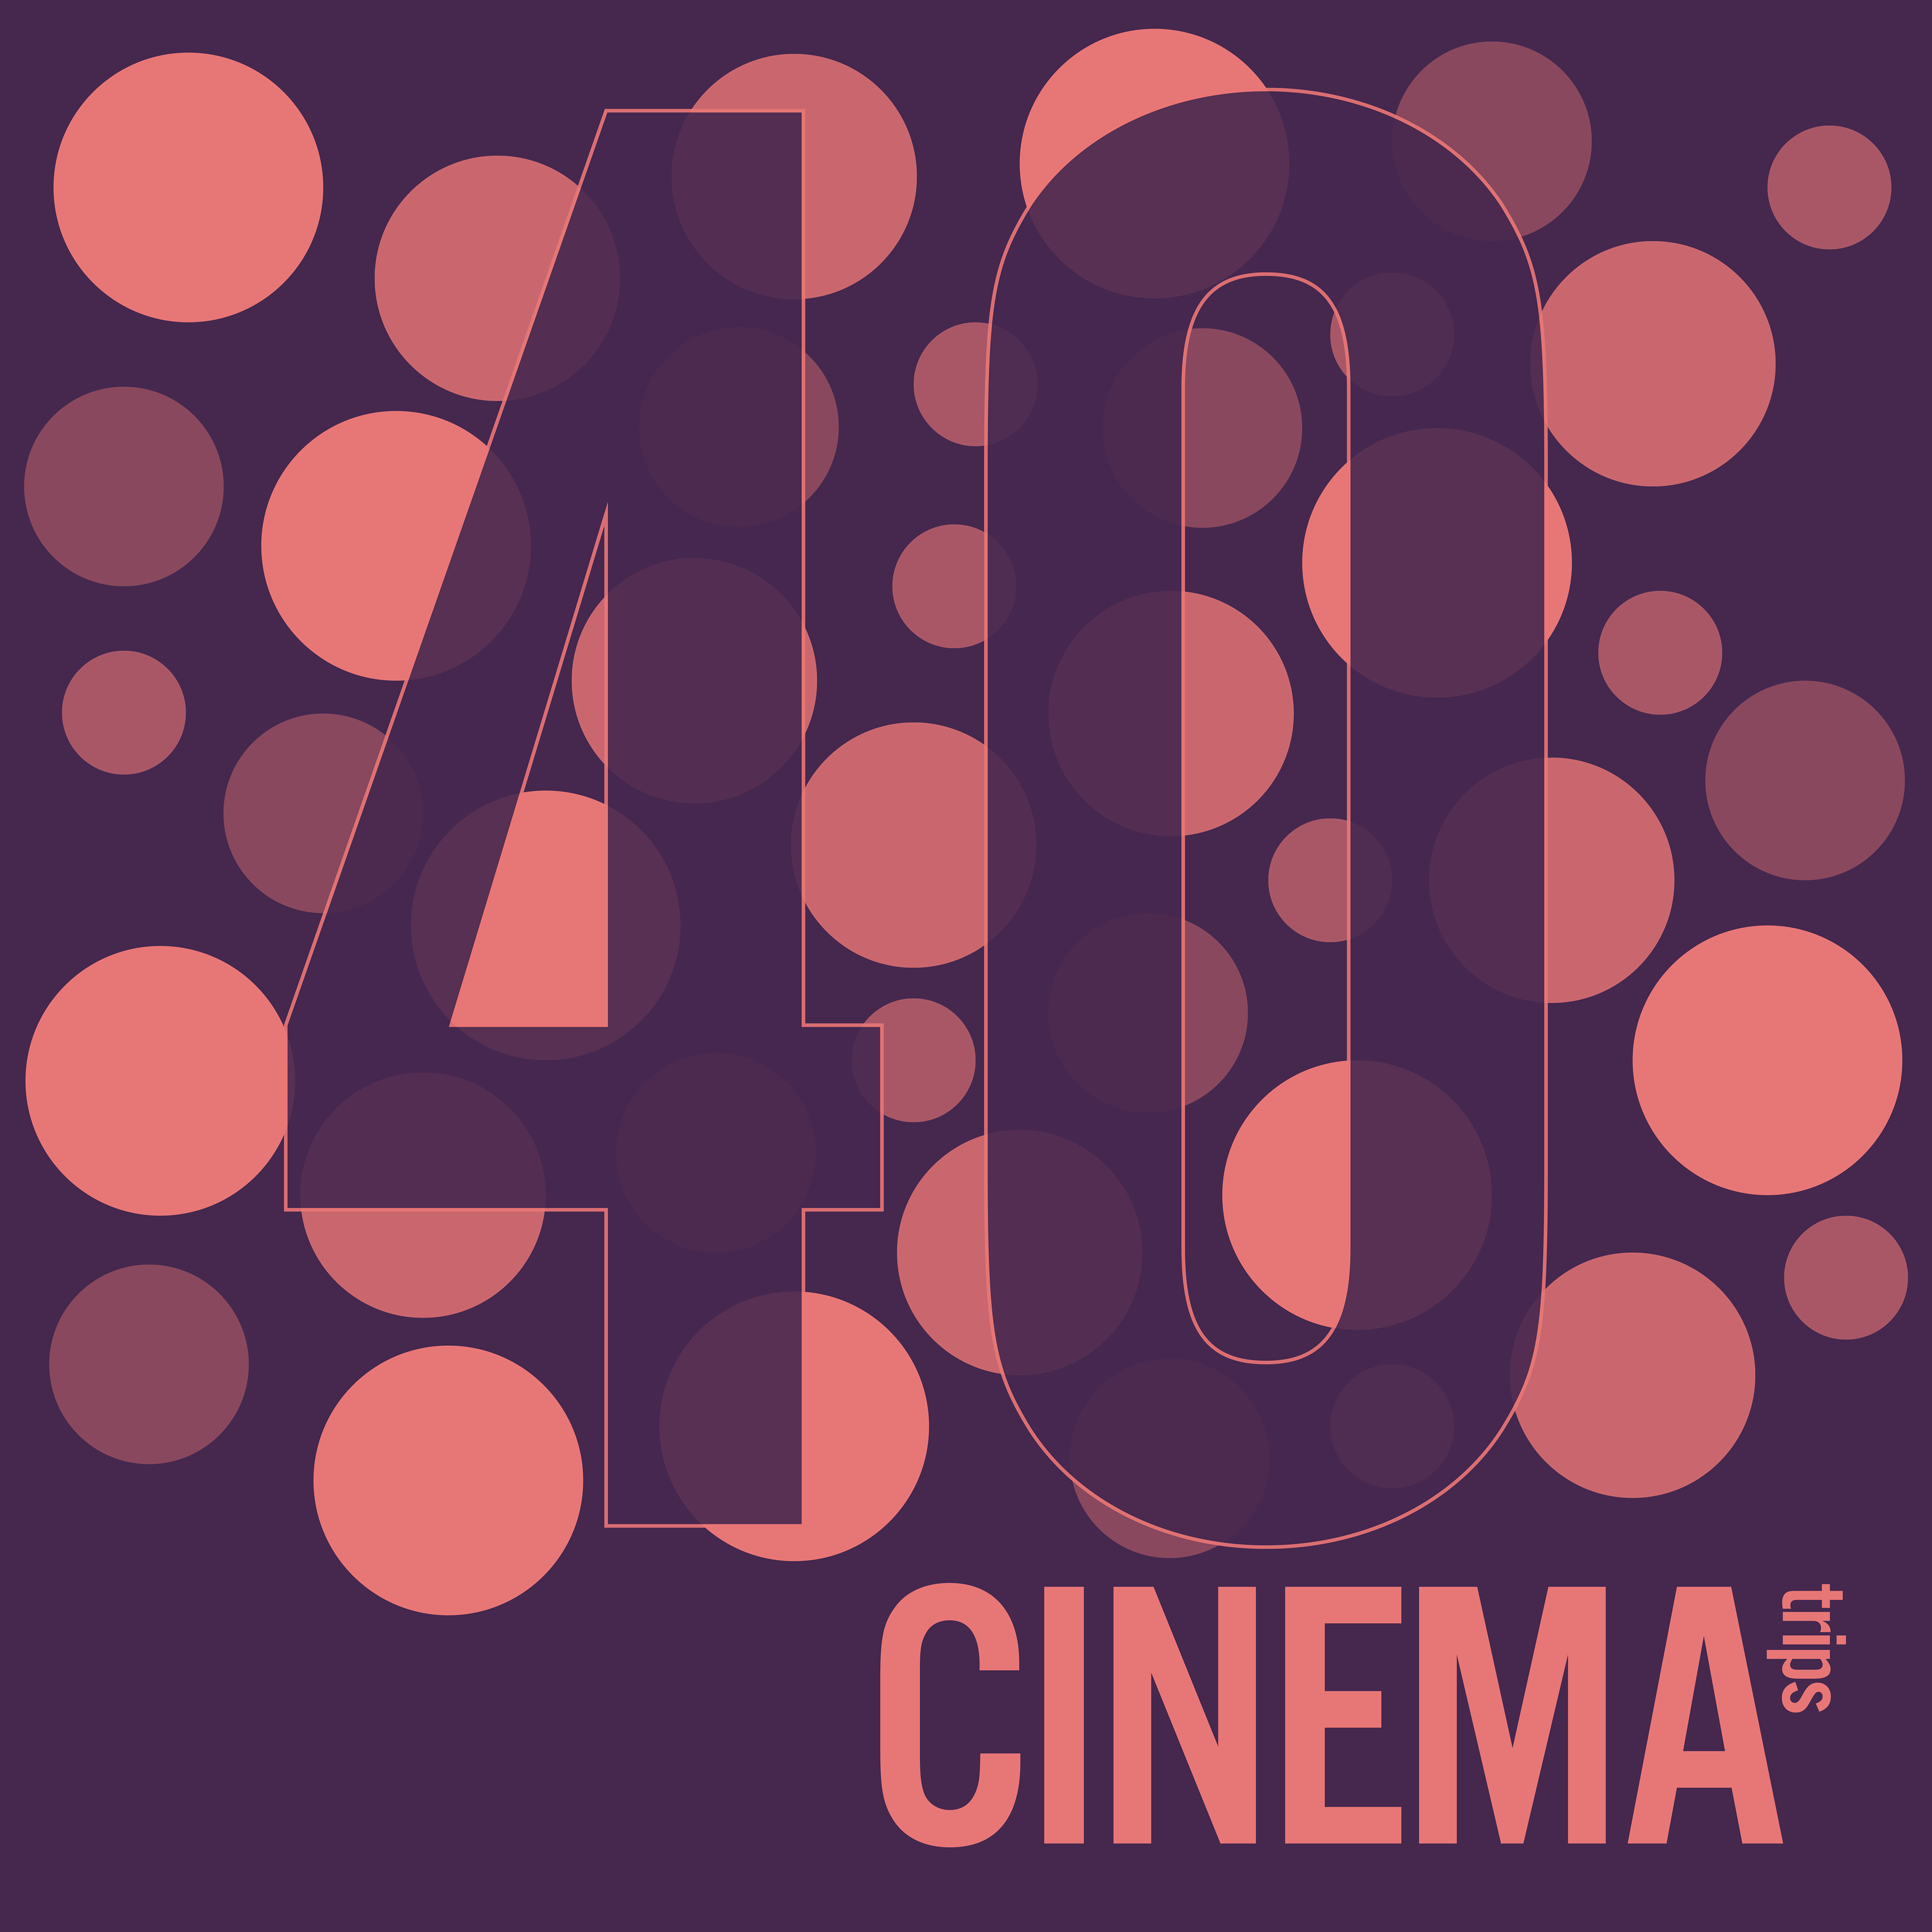
Letterboxd is a huge aid for this project. I use my diary on the app to track the months I have watched movies and the runtimes, and then compile all the data onto a spreadsheet. With the assistance of my friends Lucas and Sam, we sorted the films into nine categories before I took the data and represented it in a modern, exciting infographic.
Sandy Stats might be a sequel to MA Rewind, but it will be a franchise for years to come; rivalling Letterboxd wrapped, which is exclusive to paid members, and I'd be open to commissions to represent other people's year in film. Here's to 2026!
Typeface - Alternate Gothic No3 D
Hexcodes - 46274F (Purple), e87675 (Peach)